Anyone who has debugged a production issue by reading system logs knows the pattern: the information you need is usually there, but extracting it by hand is slow, repetitive, and error-prone. During an incident, what helps most is not more raw data, but a fast signal about what changed, where to look first, and whether immediate action is actually required.
Golem JournAI is designed to provide that signal. It is a distributed log analysis and monitoring system built on Golem Cloud. It ingests systemd journal entries, detects error spikes, runs LLM based analysis, and exposes the results through a small web dashboard.
What makes this project interesting is not only the feature set, but how it is put together. The entire pipeline runs as WebAssembly components hosted as Golem agents. Some of those agents are durable, some intentionally are not, and the boundary between the two ends up shaping most of the architecture. HTTP APIs are generated directly from a manifest rather than handwritten routing code.
This post walks through the actual implementation of JournAI on top of Golem 1.4, focusing on the design decisions that fall out of durable agents. It assumes you already understand conventional log pipelines and instead looks at what changes when state, retries, and recovery are handled by the runtime rather than by queues, schedulers, and workflow code.
What is Golem (and why durable computing matters here)
Golem is a durable computing platform for running WebAssembly components as long-lived, stateful agents. Instead of treating servers or containers as the unit of execution, Golem treats agents, instantiated from components, as the primary abstraction. Each agent has a typed public API and a stable identity. Durable agents also persist memory, environment variables, and filesystem state, along with an operation log that allows the runtime to replay execution after failures.
Those guarantees matter more than they first appear. Log pipelines are inherently stateful: you need to know what has already been processed, avoid duplicate alerts, and recover cleanly from partial failures. In most systems, that state is scattered across queues, offsets, idempotency tables, and workflow metadata. With Golem, those concerns are pushed into the runtime itself.
That changes both the architecture and the amount of code you have to write to make the system reliable.
What is Golem JournAI
JournAI is a journald-native log analysis system. It is designed to ingest high-volume system logs, detect error spikes per service over a recent window, generate incident summaries using LLMs, and present those results in a searchable dashboard.
By leveraging Golem’s durable agents, JournAI replaces a complex stack of queues, idempotency layers, and workflow engines with a small number of stateful, self-recovering components.
It overlaps in function with a classic Fluent Bit → Kafka → Elasticsearch or Loki → service layer → workflow engine stack, but it deliberately avoids reproducing that architecture. By running the pipeline itself as Golem agents, the system ends up smaller and easier to reason about, particularly when things go wrong. Recovery behavior is explicit and tied to agent identity rather than spread across multiple infrastructure layers.
Architecture at a glance
The codebase is a Cargo workspace with three WASM components and a shared library. The components are the collector, analyzer, and visualizer. The shared library holds common models and database helpers. A deployment manifest ( golem.yaml ) defines two HTTP APIs and binds them directly to agents.
The live data path is intentionally narrow. There is one ingestion path, one analysis path, and one dashboard path. That constraint is deliberate. It keeps the operational surface area small and makes failures easier to reason about.
Data flow in practice
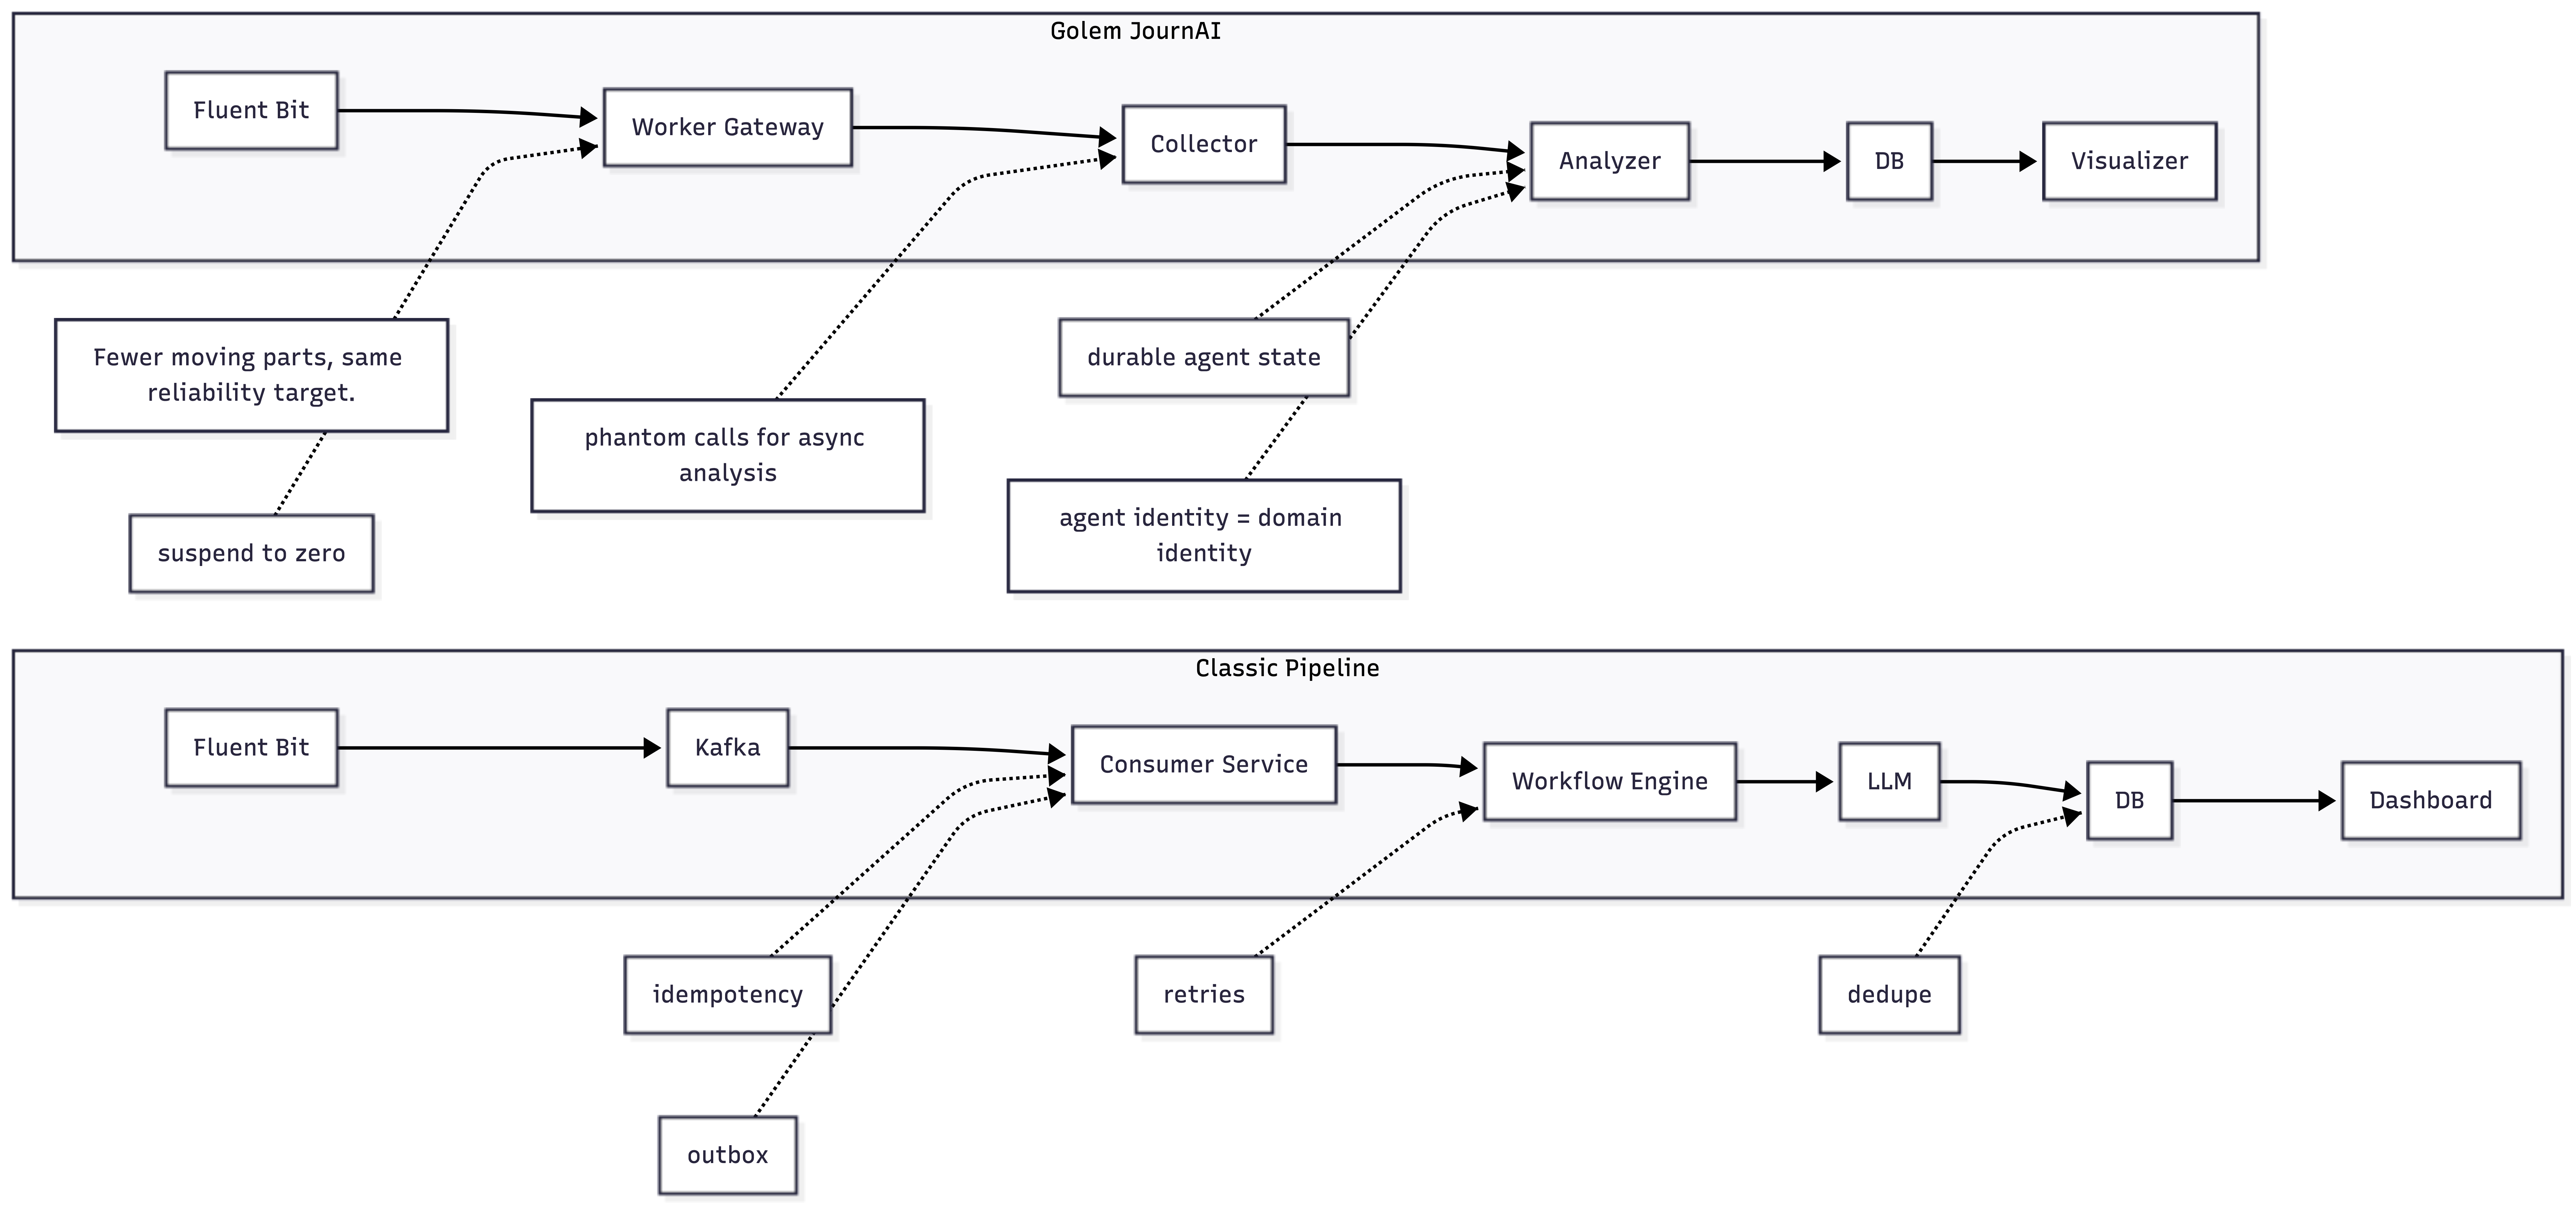
Logs are pushed to POST /collect/{hostname} by Fluent Bit. The collector validates each entry and inserts it into Postgres. When spike analysis is requested via GET /errors/{hostname}, the collector queries recent error density grouped by service name.
If a spike is detected, the collector triggers analysis by invoking an analyzer agent. This invocation is a phantom call: ingestion does not wait for analysis to complete. In practice, this keeps ingestion throughput stable even when analysis becomes slow or temporarily unavailable.
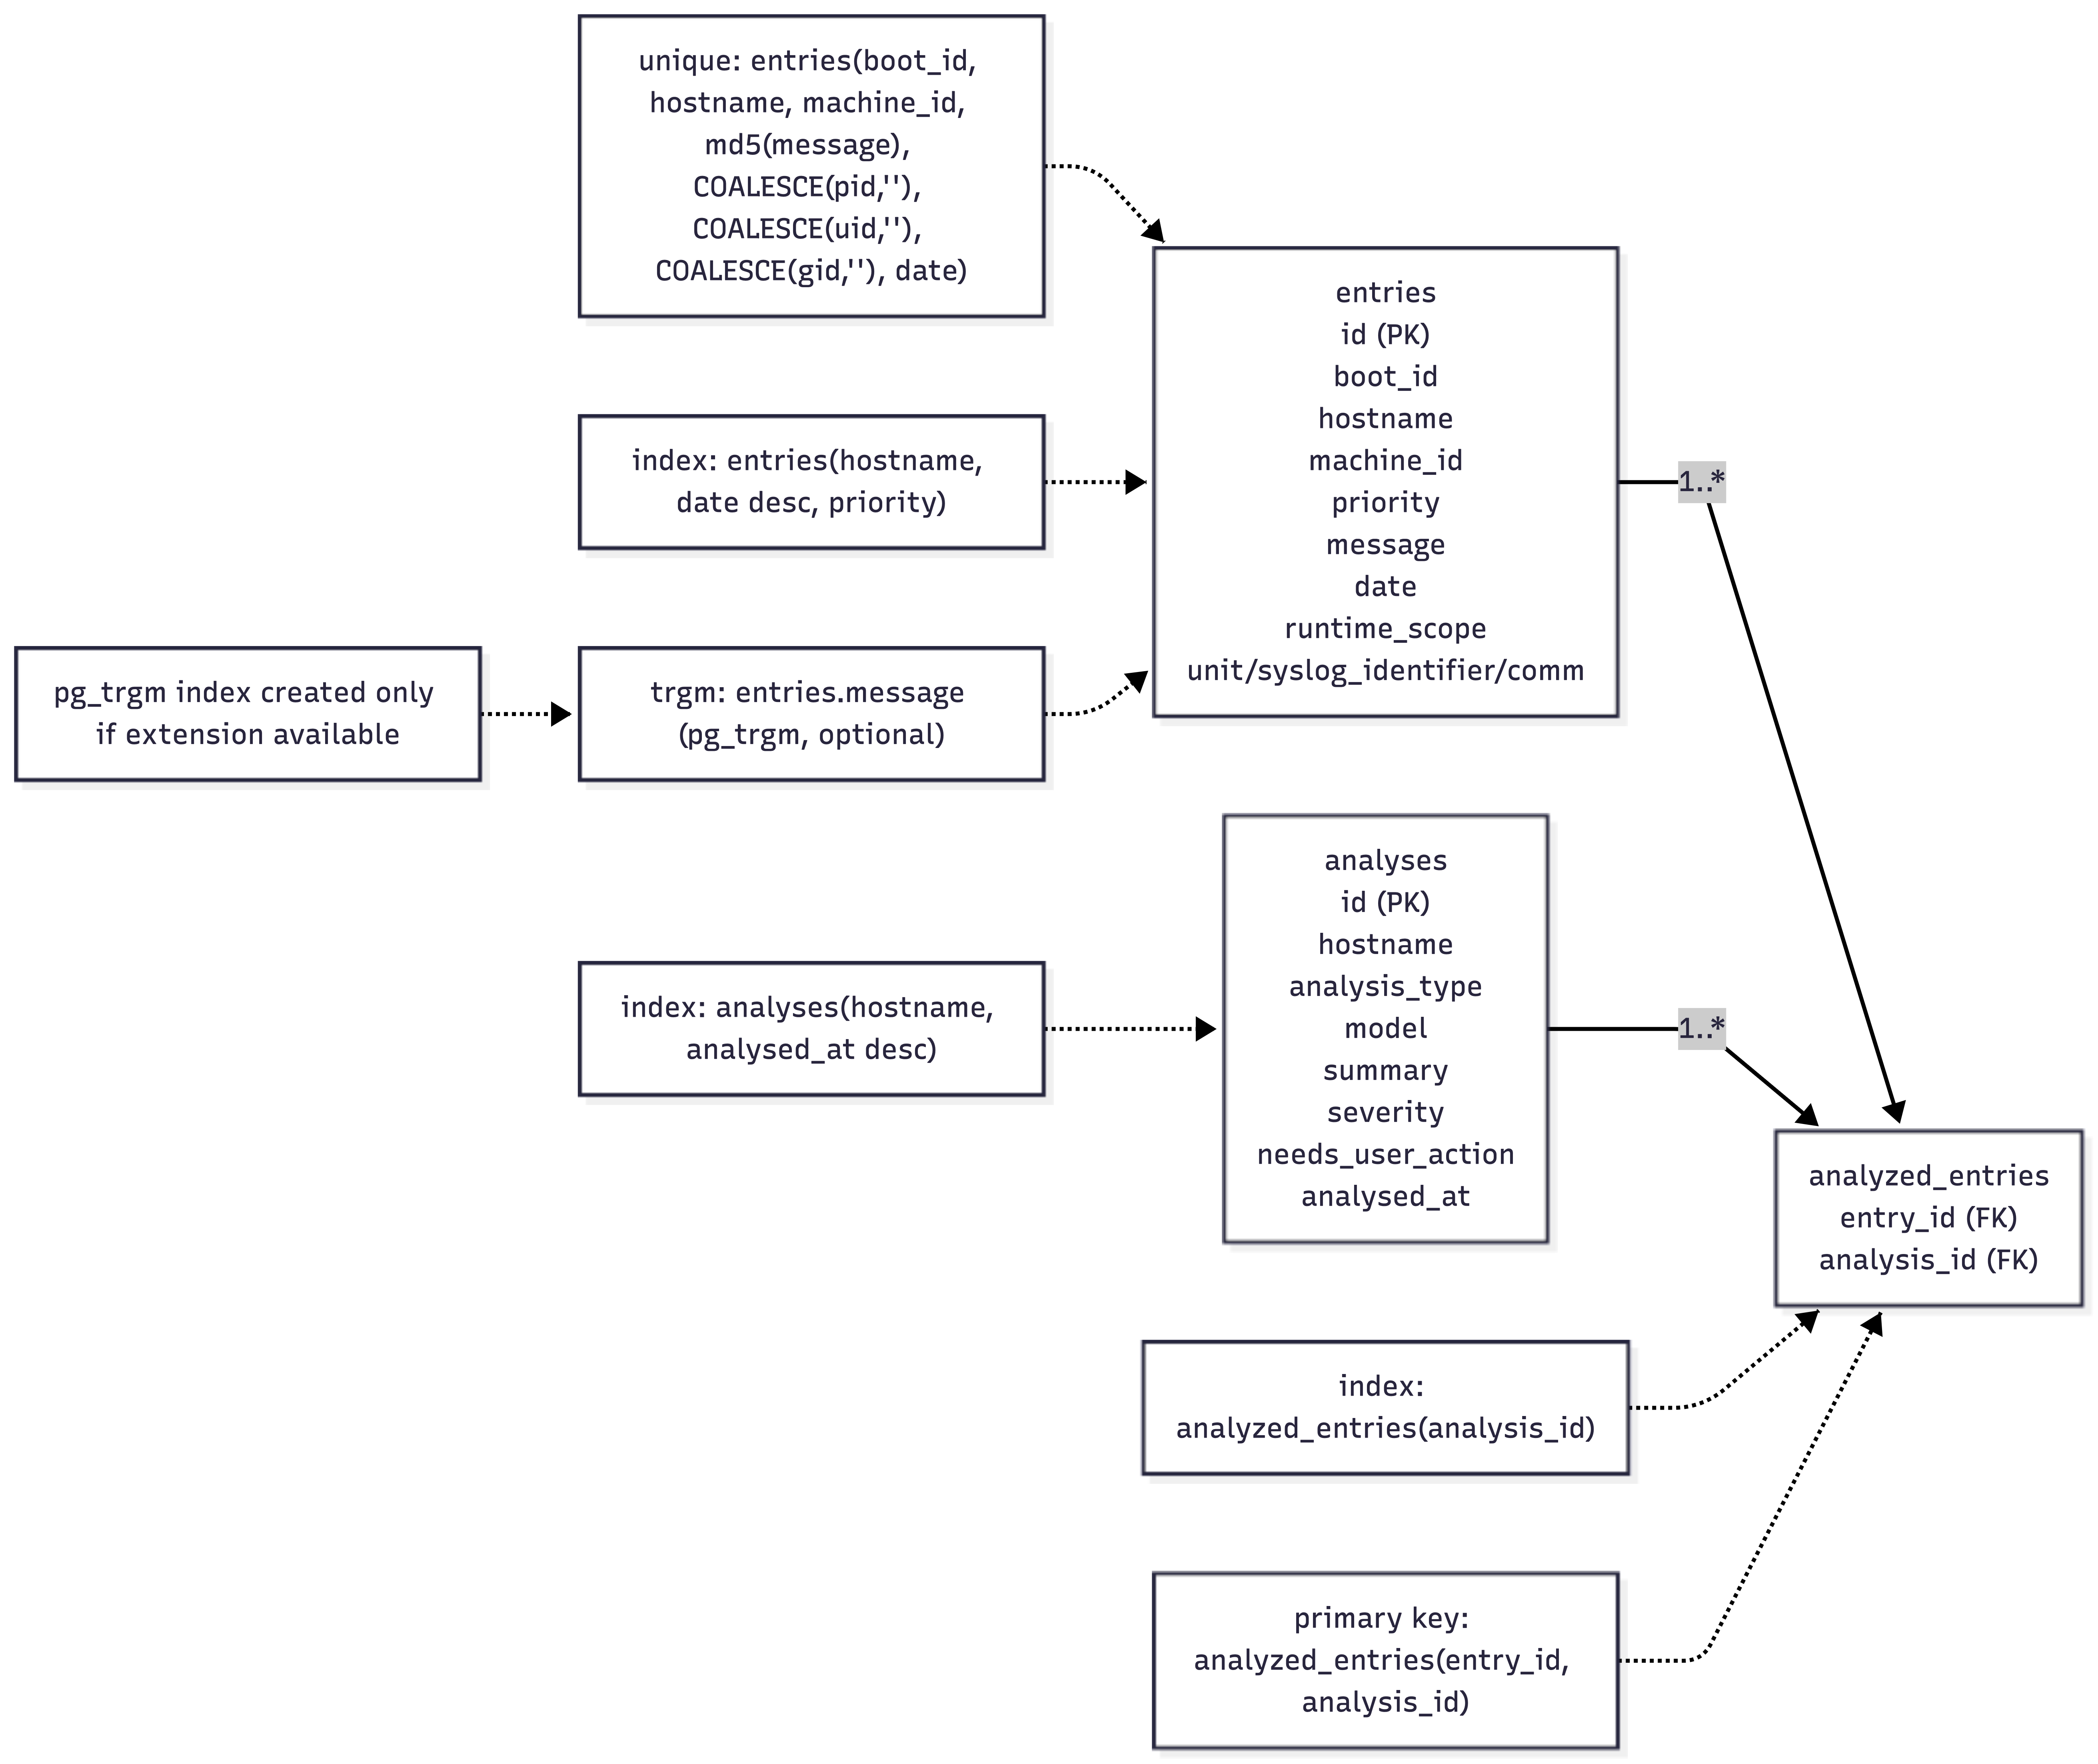
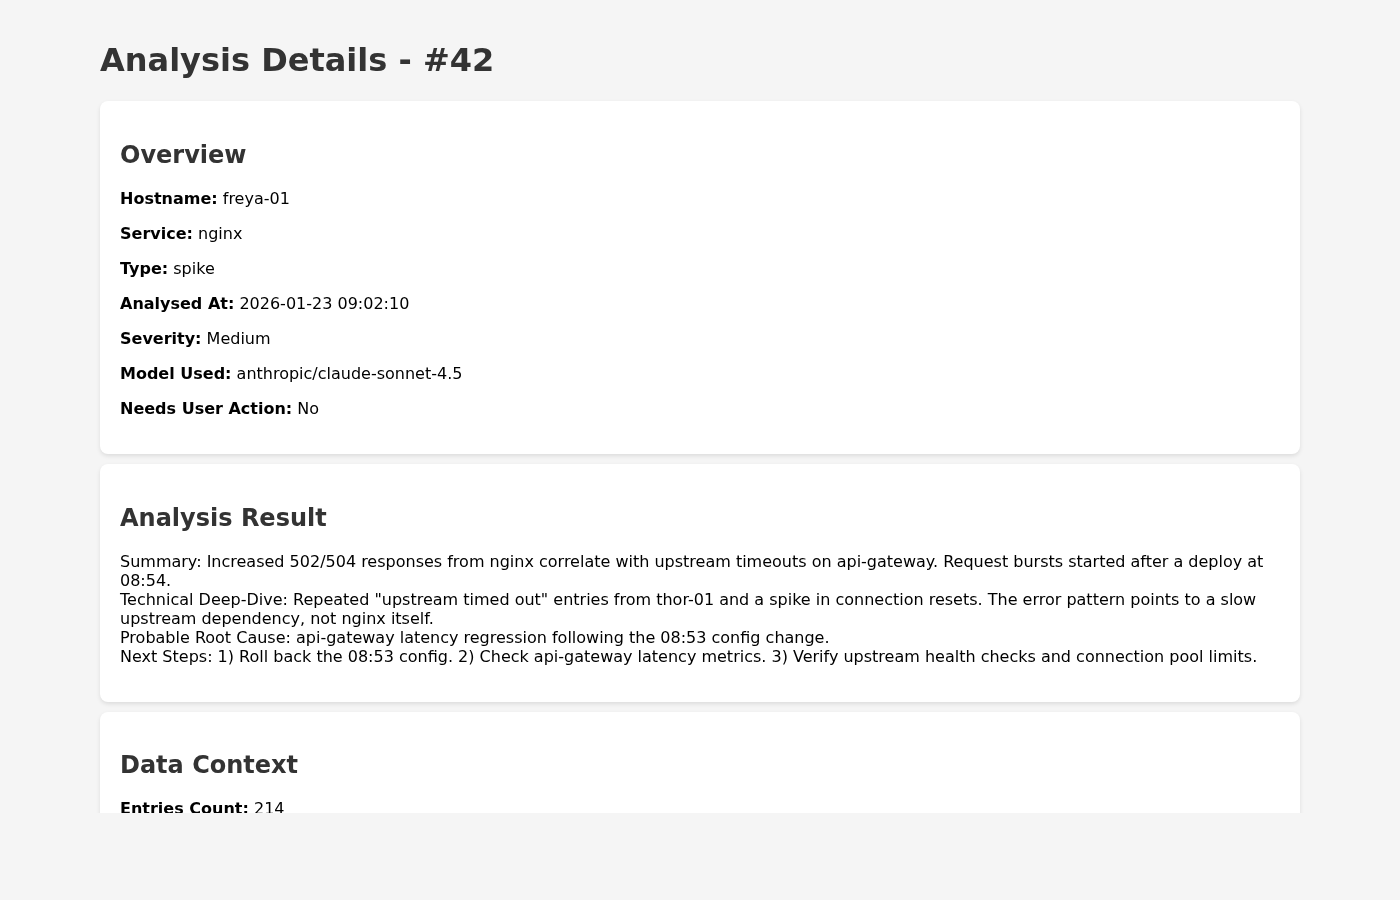
The analyzer calls an LLM to generate a human-readable summary and a structured severity assessment. Results are stored in the analyses table and linked back to the original log entries through analyzed_entries . The visualizer queries these tables and renders dashboards and detail pages.
The persistence layer is deliberately simple. There are three core tables: entries for raw journal payloads, analyses for LLM outputs, and analyzed_entries as a join table. The detailed schema, including keys and indexes, is defined below, which is close to the minimum required to trace every summary back to the exact log lines that produced it.
Component deep dive
Collector (journai:collector)
The collector is an ephemeral agent that runs per request and does not keep durable in-memory state. That choice is deliberate: the log corpus is large, shared across hosts and services, and optimized for frequent reads and aggregations. Postgres is therefore the natural home for this data. It supports fast bulk inserts and efficient time-window and message searches via indexes, and acts as the single source of truth for both the analyzer and the visualizer.
Durable agent state is used only where it adds clear value. In this system, that is the analyzer’s compact, per-service context, not the raw log stream itself. On ingestion, each entry is validated (hostname match, priority in the 0–7 range, non-empty message) and inserted in chunks to stay within Postgres parameter limits. The collector also exposes a small query API, which is used to compute error density during spike detection.
Spike detection itself is intentionally simple. It is a database query that groups by a derived service name (from journal fields such as unit , syslog_identifier , and comm) and looks for elevated error density. There are more sophisticated approaches, but this one is easy to implement, inexpensive to run, and predictable under load.
Triggering analysis via phantom calls decouples ingestion from analysis. In practice, this single decision had a larger impact on system behavior than any individual optimization. Specifically, by making the analysis trigger a fire-and-forget phantom call, the collector’s ingestion path never waits for the LLM-bound analyzer. This guarantees that log ingestion throughput remains stable even when the analyzer agent is slow, suspended, or temporarily unavailable.
Analyzer (journai:analyzer)
The analyzer is a durable agent keyed by (hostname, service_name) . That identity choice is central to the design. It means each service effectively has its own long-lived analysis context without introducing a separate cache or coordination layer.
The system is designed to be highly model-agnostic and could theoretically reanalyze the same log entries with multiple models. The analysis logic relies on the model’s ability to return a well formed JSON object, which is then validated against a local schema. The Analyzer component accesses the LLM provider (such as OpenRouter) through Golem’s built-in AI WASM dependencies. For instance, examples in the dashboard currently show the use of anthropic/claude-sonnet-4.5 for summary generation.
For each spike, the analyzer performs two LLM calls. One produces a detailed incident summary written in an SRE-style format. The other produces a strict JSON response that classifies severity and whether user action is required.
Two constraints shaped the implementation. First, context size has to be bounded. The analyzer compacts its conversation history and uses a reduced “lite” prompt to keep token usage under control. Second, structured output must be reliable. JSON responses are validated against a schema and discarded if they fail to parse cleanly. In practice, this avoids a surprising number of downstream problems.

Visualizer (journai:visualizer)
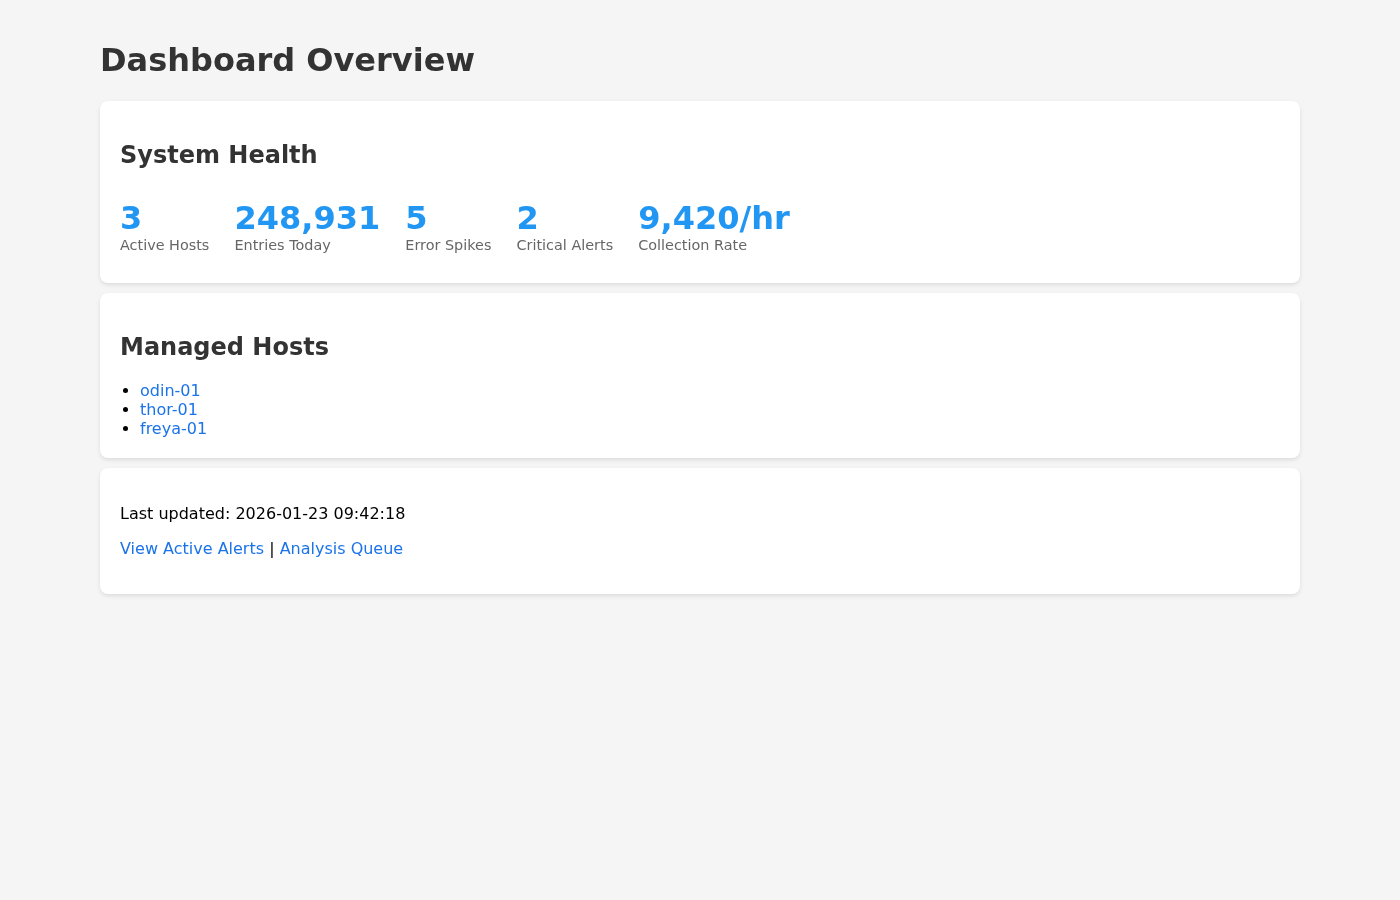
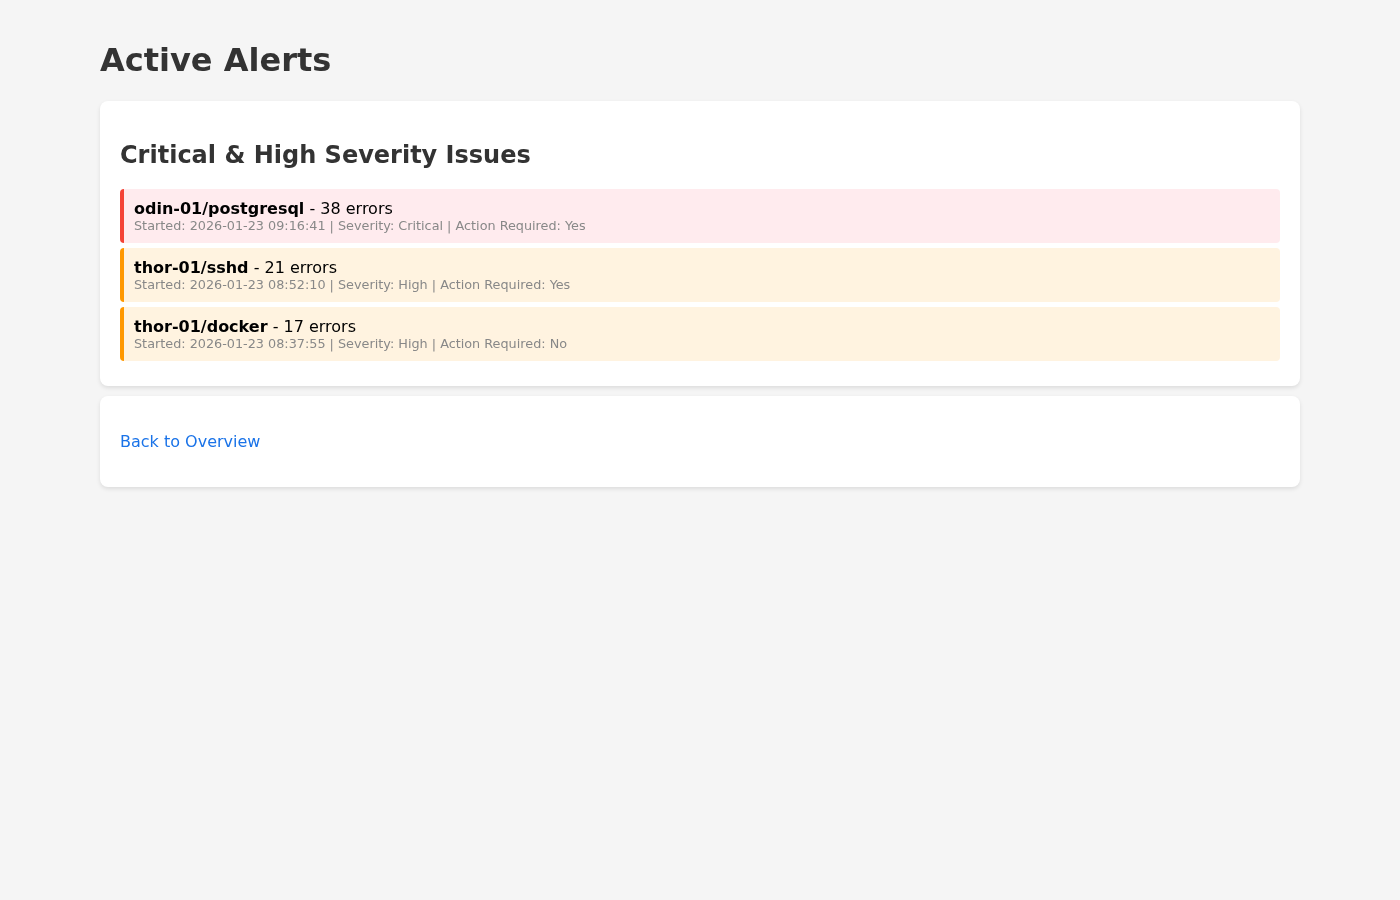
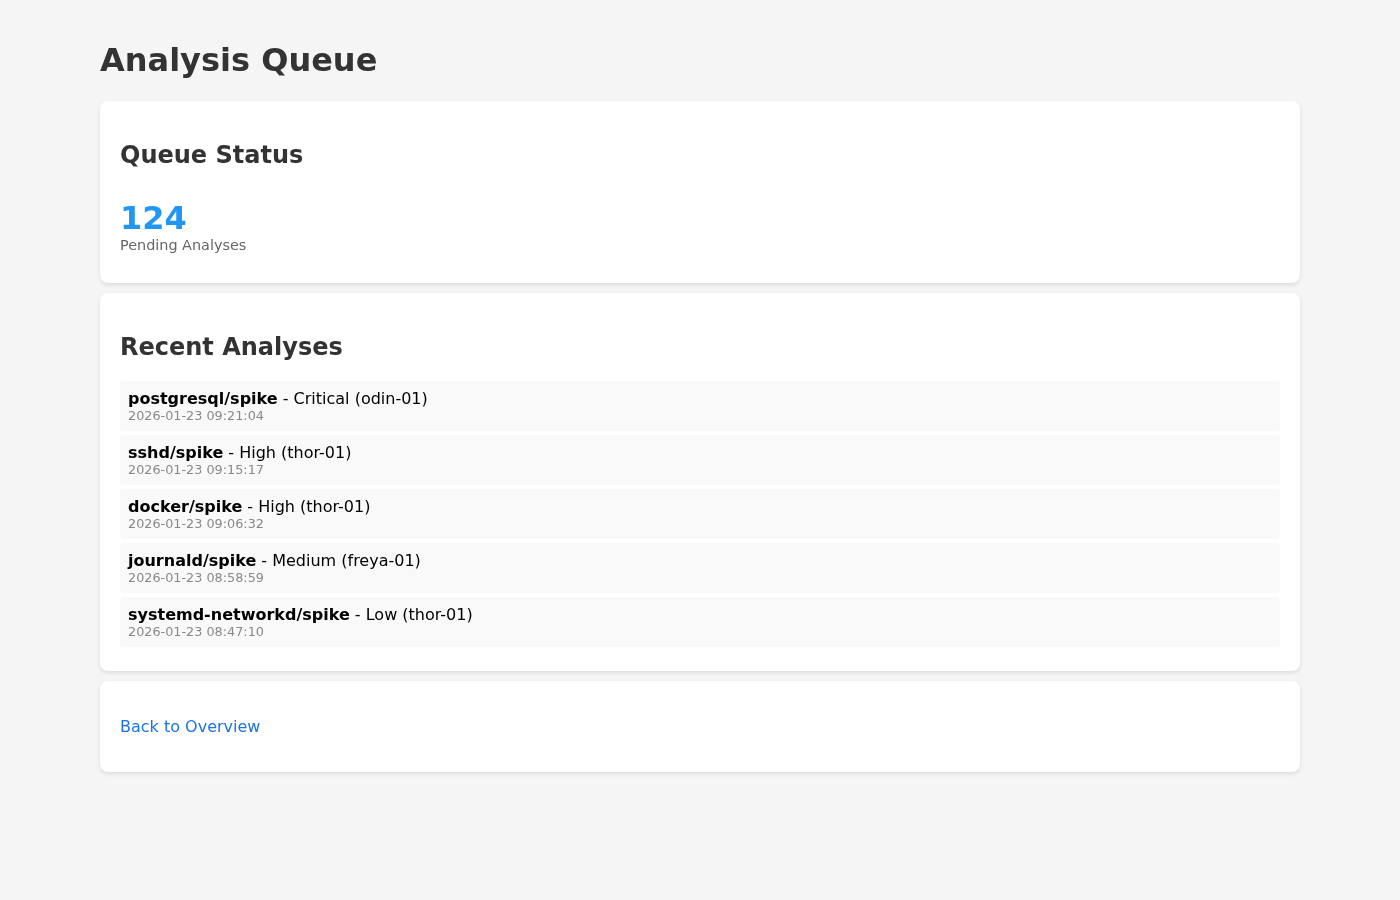
The visualizer is an ephemeral agent that renders minimal HTML. There is no frontend framework. It serves persisted, queryable state directly from Postgres and prioritizes clarity over interactivity.
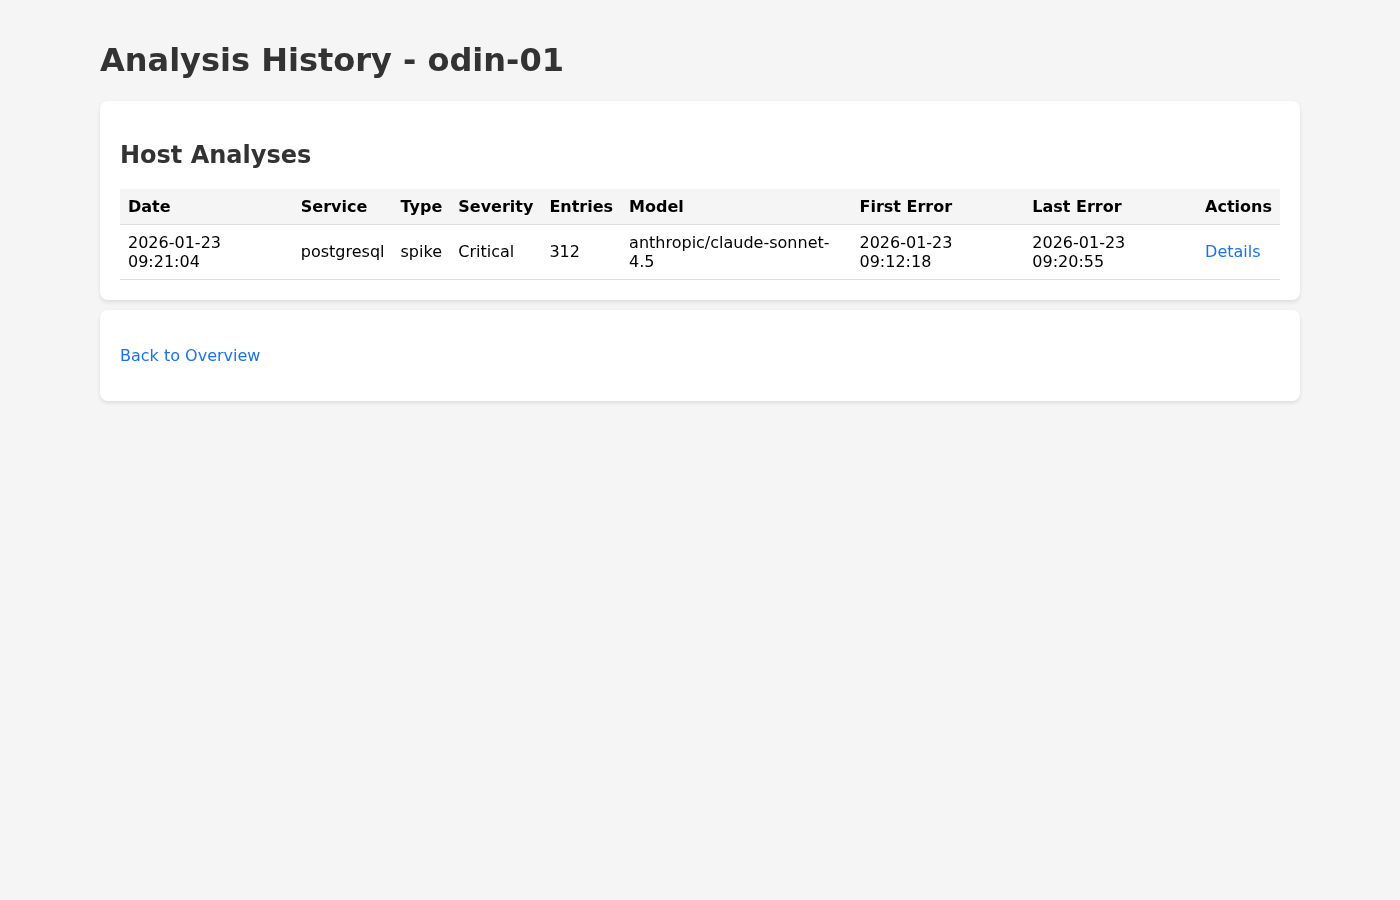
It provides a system overview dashboard, an alerts view for high and critical analyses, a queue view with a pending count derived from recent error entries and a list of recent analyses, per-host history pages, and a details page showing the summary and its metadata. The output is intentionally simple, which makes it easy to host, cache, and extend without reworking the backend.
Where Golem shapes the design
Many of the design decisions in JournAI only make sense because of Golem’s durability model. Constructor parameters encode domain identity: the collector is invoked per hostname, while the analyzer’s durable identity is (hostname, service_name) . That makes per-host and per-service state explicit and removes the need for a separate key-value store.
The Worker Gateway handles routing and retries, so HTTP requests are delivered to the correct agent instance even across executor failures. Agent-to-agent calls are reliable, and suspend-to-zero keeps costs down during quiet periods. Each of these properties removes infrastructure that would otherwise need to be built, monitored, and debugged separately.
Golem 1.4 features that matter
This project targets and relies on several features introduced in the Golem 1.4 release. The Rust SDK provides the agent APIs used throughout the codebase. Agent mode is used to keep the collector ephemeral and the analyzer durable. HTTP APIs are defined declaratively in the manifest. Phantom calls enable fire-and-forget analysis triggers. Golem’s AI WASM dependencies are used to integrate LLM providers such as OpenRouter.
The practical takeaway is that Golem 1.4 is stable enough to build a complete pipeline with durable state, custom HTTP APIs, database access, and LLM integration without layering additional services on top.
What makes Golem and JournAI different
Traditional log pipelines achieve reliability by layering infrastructure: durable queues, consumer offsets, idempotency logic, workflow engines, and tooling to reconstruct what happened after a failure. A common setup is Fluent Bit feeding Kafka, with downstream consumers writing to Elastic or Loki and a service layer coordinating analysis jobs. This model is well understood and scales to high throughput and fan-out, but it also introduces more moving parts and a larger failure surface to reason about.
Golem takes a different approach by pushing much of that responsibility into the runtime. You still write ordinary application code. The platform handles execution, state, and recovery transactionally. In JournAI, ingestion is a direct HTTP call to the collector, analysis is triggered via a phantom agent call, and durable state is used only where it clearly adds value. The analyzer keeps a compact, per-service context window, while the bulk log corpus remains in Postgres.
These differences show up directly in the code. The collector is ephemeral and performs chunked inserts into Postgres, with indexes tuned for time-window queries and message search. The analyzer is a durable agent keyed by (hostname, service_name) and writes its results to the analyses table, with a join table linking each analysis back to the exact log entry IDs that produced it. The visualizer reads from the same tables and renders HTML directly, without a separate service tier. Recovery largely comes down to agent identity and database state, rather than replaying chains of queue offsets and job metadata.
The tradeoffs are explicit. On the downside, Postgres becomes a central dependency and can be a bottleneck under bursty ingestion if it is not sized appropriately. The database and gateway absorb the load directly, so capacity planning matters. External calls still require idempotency discipline, since retries can re-trigger LLM work.
On the plus side, there are fewer components to operate, recovery paths are easier to explain, and idle costs stay low thanks to suspend-to-zero. State is also cleanly divided: durable agents hold short-term context, while Postgres is responsible for long-term storage and indexing.
Lessons learned
The most important lesson from building JournAI is that agent identity becomes part of the data model. Once that is embraced, per-host and per-service state falls out naturally, and the temptation to add secondary state stores fades.
Bounding LLM context early is also critical. The compacted history and reduced prompts in the analyzer are not micro-optimizations; without them, costs and latency become unpredictable. Finally, storing analysis results alongside the exact log entry IDs that produced them makes the system auditable and helps answer uncomfortable “why did it say this?” questions.
Future developments
Several extensions would make JournAI more useful in production. One is a human-in-the-loop workflow for critical alerts: when severity is High or Critical, the analyzer could notify a human, include the summary and a proposed remediation checklist, and require explicit acknowledgment or override.
Another is feedback on analysis quality. Allowing on-call engineers to rate or annotate analyses would make it possible to adapt prompts and model choices per service over time. More
sophisticated spike detection based on historical baselines would also reduce false positives. Finally, exporting results to external observability systems via OpenTelemetry or webhooks would ease integration with existing SOC and SRE workflows.
It would also be worth addressing the operational downsides called out earlier. On the storage side, Postgres can be scaled with partitioning, stricter retention policies, or a read replica for the visualizer. For LLM calls, adding idempotency keys and a short-lived response cache would reduce duplicate work when retries happen. If multi-tenant isolation becomes a hard requirement, separate databases or per-tenant collector and analyzer instances could provide clearer resource boundaries without changing the core design.
Final notes
JournAI is a concrete example of how durable computing changes system design. A problem that usually requires multiple infrastructure layers can be expressed using a small number of focused components with clear responsibilities. The runtime handles state, recovery, retries, and routing. The code focuses on analyzing logs and producing useful signal.
If you are evaluating durable computing for production systems, this project is a practical reference. It shows what changes when durability is treated as a runtime property rather than an application-level concern.

